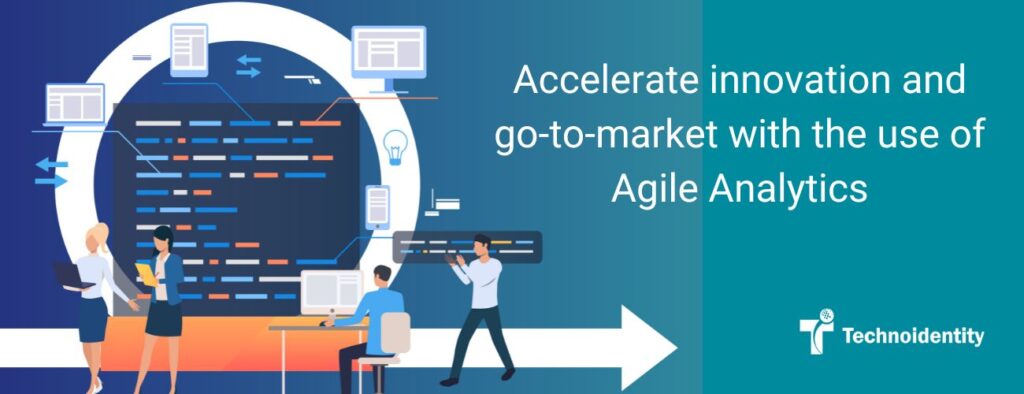
In a world defined by uncertainty, speed, and constant change, businesses must adapt rapidly to stay competitive. This new reality has given rise to a transformative approach to business decision-making: Agile Analytics. As we transition from the age of traditional marketing to a more responsive and fast-paced era, Agile Analytics equips businesses with the capability to navigate swiftly and stay ahead of the curve.
What is Agile Analytics?
Agile Analytics is an iterative, data-driven methodology that takes data analysis beyond the confines of conventional research methods, such as surveys or lab testing. It presents a dynamic, rapid approach that leverages real-time data, allowing businesses to respond swiftly to market changes with actionable insights.
This dynamic approach fosters an environment of rapid, iterative learning cycles, promoting constant adaptation and improvement. It dissects complex challenges into manageable chunks, enabling businesses to make data-informed decisions swiftly.
Agile Analytics thus breaks free from the shackles of traditional decision-making methods that often get trapped in a small set of assumptions, bringing forth an innovative alternative that combines traditional methods of analyzing large amounts of data with new techniques borrowed from software development and project management.

Data visualization
To further enhance the capabilities of Agile Analytics, data visualization tools have become indispensable. These tools simplify complex datasets, providing insights that help businesses make data-driven decisions. In the race for a competitive edge, businesses cannot merely rely on innovative ideas; they must know how these ideas can be translated into profits. Data visualization tools facilitate this translation process.
When applied to analytics, the Agile methodology provides significant benefits to both business and data teams. It helps deliver insights rapidly and promotes a culture of incremental progress, leading to more effective outcomes and higher business value in shorter time frames.
Agile analytics employs various tools, including kanban boards, scrums, workflows, and Gantt charts, to help prioritize tasks and visualize the planning process.
Decision-making using Agile Analytics
What makes a BI tool truly agile is its flexibility. It should allow analysts to navigate through a workflow without the need to switch tools, work with both raw and modeled data, move from SQL Editor to Notebooks to visualizations within a single platform, and accommodate both business and data team workflows. The end goal is to enable analysts to help companies make informed decisions, focus on their core competencies, and keep the business team satisfied.
The Processes:
Since agile analytics is a collaborative process, it involves a set of standard processes around what you are trying to achieve and why. However, agile analytics and agile methodology go hand-in-hand:
- Incorporates user feedback in each release cycle
- Creates workflows and makes it scalable
Agile analytics will make you focus on the goals and keeps the teams on the track with real-time data in place. Here are a few considerations or aspects for making it implemented from end-to-end in your organization:
- Prioritizes decision-making over dashboard views
- Makes you to act quickly on the iterations
- Automates reports and repeated manual processes
- Data visualization enables your key stakeholders to take informed decisions based on the performance of the projects and teams
Agile Analytics is an essential strategy for any business seeking to gain a competitive edge in today’s data-driven world. By leveraging Agile Analytics, businesses can create a flexible, efficient, and collaborative data culture that paves the way to sustainable growth and success.


